The most illustrative part of crypto scam investigation is visualizing the flow of funds through transactions and addresses associated with a scammer’s wallet. This method allows us to reveal related addresses or their clusters and also to track funds to certain centralized exchanges where they can be potentially cashed out. Additionally, we can also include in the graph other entities related to scammer in order to create a full picture.
We will approach this task using two different investigation tools: Maltego CE and GraphSense. Both tools are available for free in non-commercial versions.
Toolbox
Maltego is an open source intelligence (OSINT) and graphical link analysis tool for gathering and connecting information for investigative tasks. It is a comprehensive tool that offers real-time data mining and information gathering, as well as the representation of this information on a node-based graph, making patterns and multiple order connections between said information easily identifiable. Great thing about Maltego is that one can start with manually putting entities on the graph to start an investigation, and then use powerful transforms for further data mining process, which are basically methods for searching related entities for already known ones.
For cryptocurrency investigations, a specific Maltego transform library is used, which allows to represent cryptocurrency entities like addresses and transactions, and fetch related data automatically from blockchain.
GraphSense is an open source cryptoasset analytics platform which provides a dashboard for interactive investigations, allowing users to explore transactions, visualize and follow the money flow. It uses different data sources for attribution of addresses which belong to certain crypto exchanges or other types of known entities.
In some sense, these tools complement each other in the course of an investigation, as Maltego allows us to use many different entities beyond the scope of just blockchain data, thus building full picture of the investigated case which may include different data points and entities connected not only to blockchain, but also to persons, websites, networks etc, whereas GraphSense helps us to easily perform crypto wallets attribution and clustering, something which standard Maltego tools are not capable of.
Scammer’s profile and data
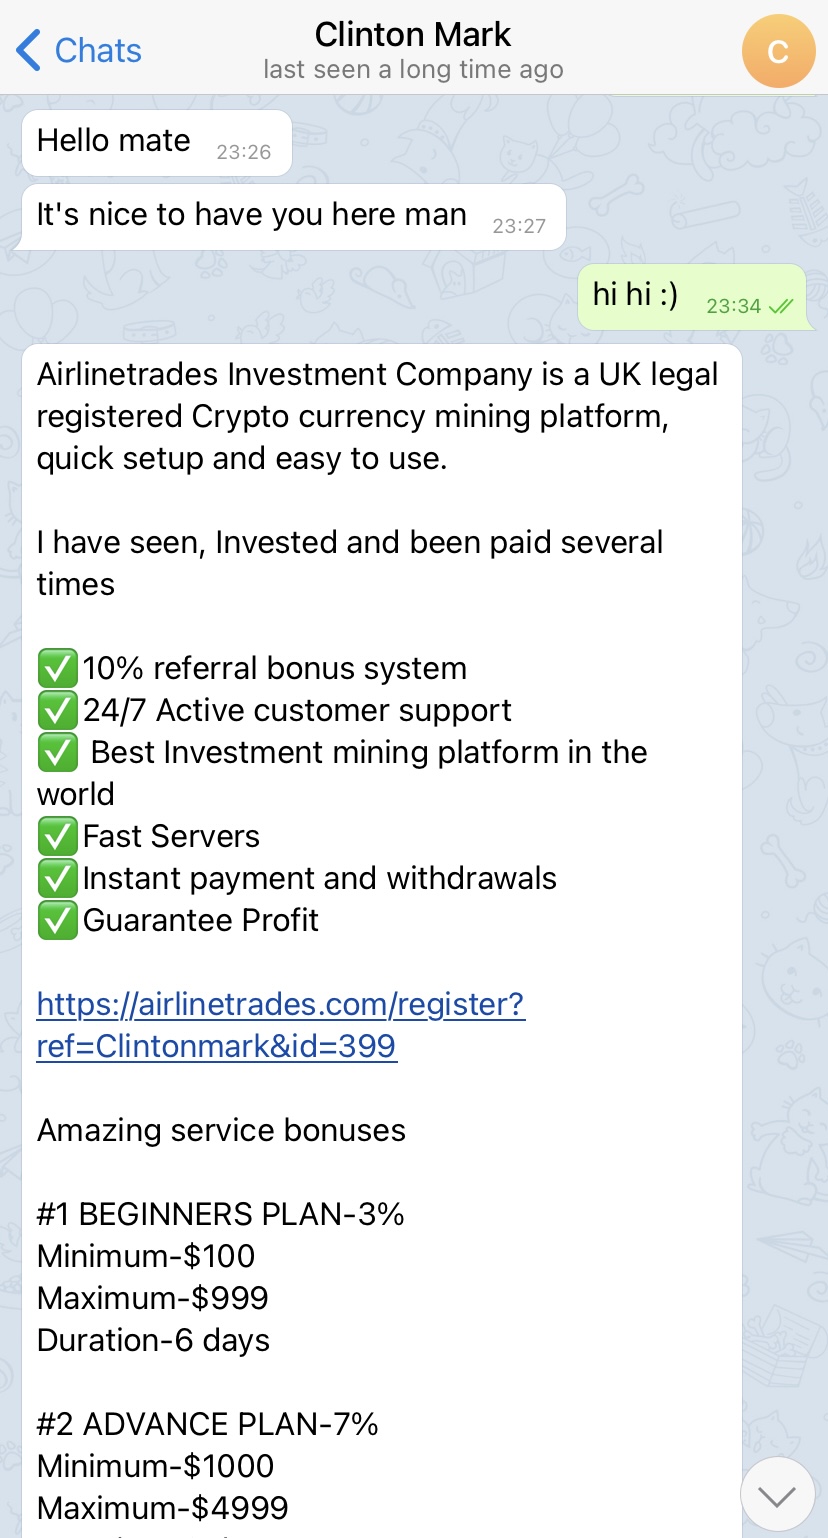
Let’s investigate one typical case of a crypto scammer from Instagram. This guy doesn’t pose himself as a trader, but as a successful investor who was lucky enough to find a great oportunity to multiple his money and is eager to share it with others:


Curiously, reverse search of one photo from his Instagram profile leads us to someone named Authur Grey of Los Angeles, 57 years old, who has a profile on a Russian dating site Mamba. However, his personality is not the main point of our investigation:

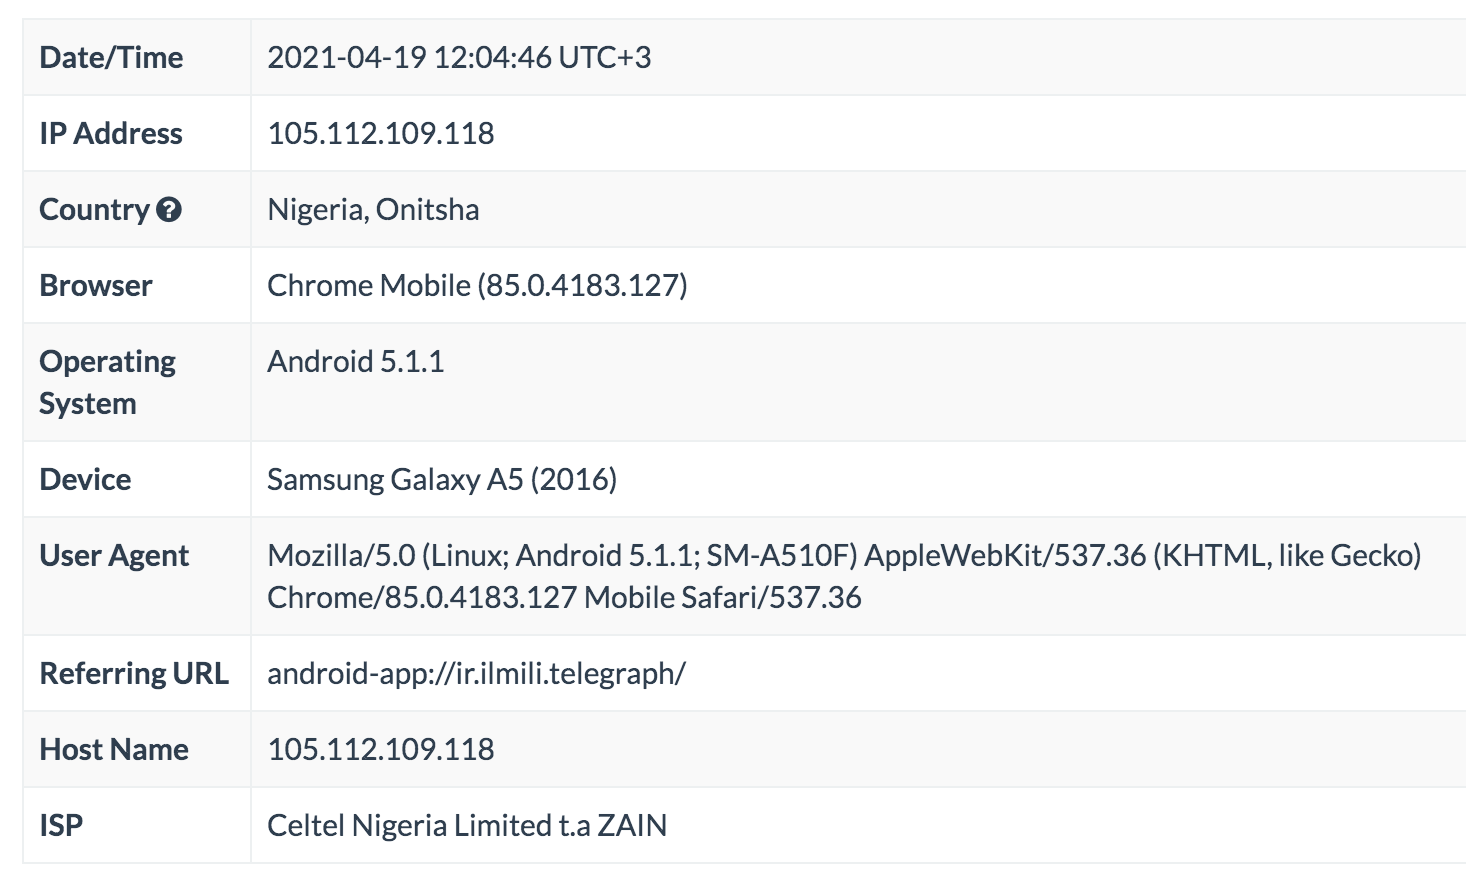
We were able to track down scammer’s IP address which has also given us information about ISP, geolocation and some technical parameters of the mobile device:
And, of course, scam website reveals us a wallet address which is meant for ‘depositing your trading account’. At the moment of investigation it was bitcoin address 3HAhjwSM27xRAXp1J9zwGZHxHhdqbV3j9s (later changed for different one):

This address has one outgoing transaction. So far, we have enough data to investigate this scam scheme.
Following the money
Flow of funds graph does not always precisely track a movement of an exact sum from scammer’s wallet, because very often funds are going through a chain of intermediary wallets, mixed with other fund sources, and the transactions in between might have many inputs and outputs besides those that are related to the case. But it gives a good idea of how flow of funds is organized in the close proximity of scammer’s wallet, and in which exchanges the funds may potentially end up to be cashed out. And in numerous lucky cases we are even able to track funds movements really precise.
Maltego CE graph
Below is a full view of investigation graph made using Maltego CE software which describes the case (however it is here for illustrative purposes and not fully completed as it could be, you will understand later why):

Let’s look closer separately at top and bottom parts of the whole graph.
Top part depicts entities connected with the scammer’s person: website, smartphone model, social accounts. On next level we add related entities like IP address of the connection, cellular provider, location, etc. It should be noted here that Maltego allows us to pull many related entites automatically using transforms, so it is obviously not a fully manual process. Starting from scam website address and IP address of cellular connection, all underlying entites (for example, geolocation, ISP name, hosting company, name servers etc) are found automatically, which unleashes a true power of Maltego as an investigation tool.

In the right part of the graph we also add a wallet address from scam website to further track flow of funds. Here we use standard entites like bitcoin address, transaction, and also transaction timestamp obtained from blockchain data:

Again, just for the illustrative purposes we limit the graph and, for example, don’t trace flow of funds further from certain nodes (like an address 14iTZTqdojB8SPw6ZyV9Se899AzvDtM3Fv above, which is left ‘hanging’), however surely it may be traced further to make a bigger picture. We will extend the graph a bit later using GraphSense tool.
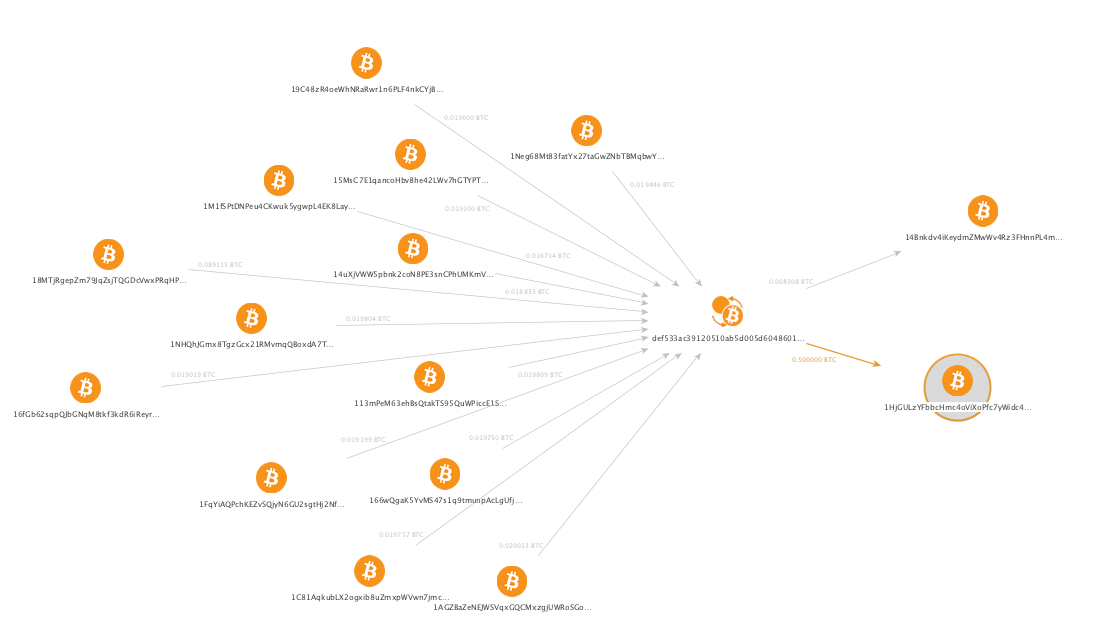
We should also note here that, as Bitcoin is a transaction based network, the transaction itself is a separate entity shown on the graph between each of the involved addresses. Why don’t we just depict flow of funds between two addresses? This is because each transaction might have multiple inputs and outputs, and some of them might not be involved in a scheme in question. For example, the graph below depicts funds moving between 1M1fSPtDNPeu4CKwuk5ygwpL4EK8LayumB and 1HjGULzYFbbcHmc4oViXoPfc7yWidc4j1B (bottom right), but the transaction in between has 24 input addresses (23 of which are not shown) so we see 0.016714 BTC as input but 0.5 BTC as output, which may seem confusing at first sight.

Actually the graph should look more like this, and with even more inputs to the left (here, only 12 inputs are shown):
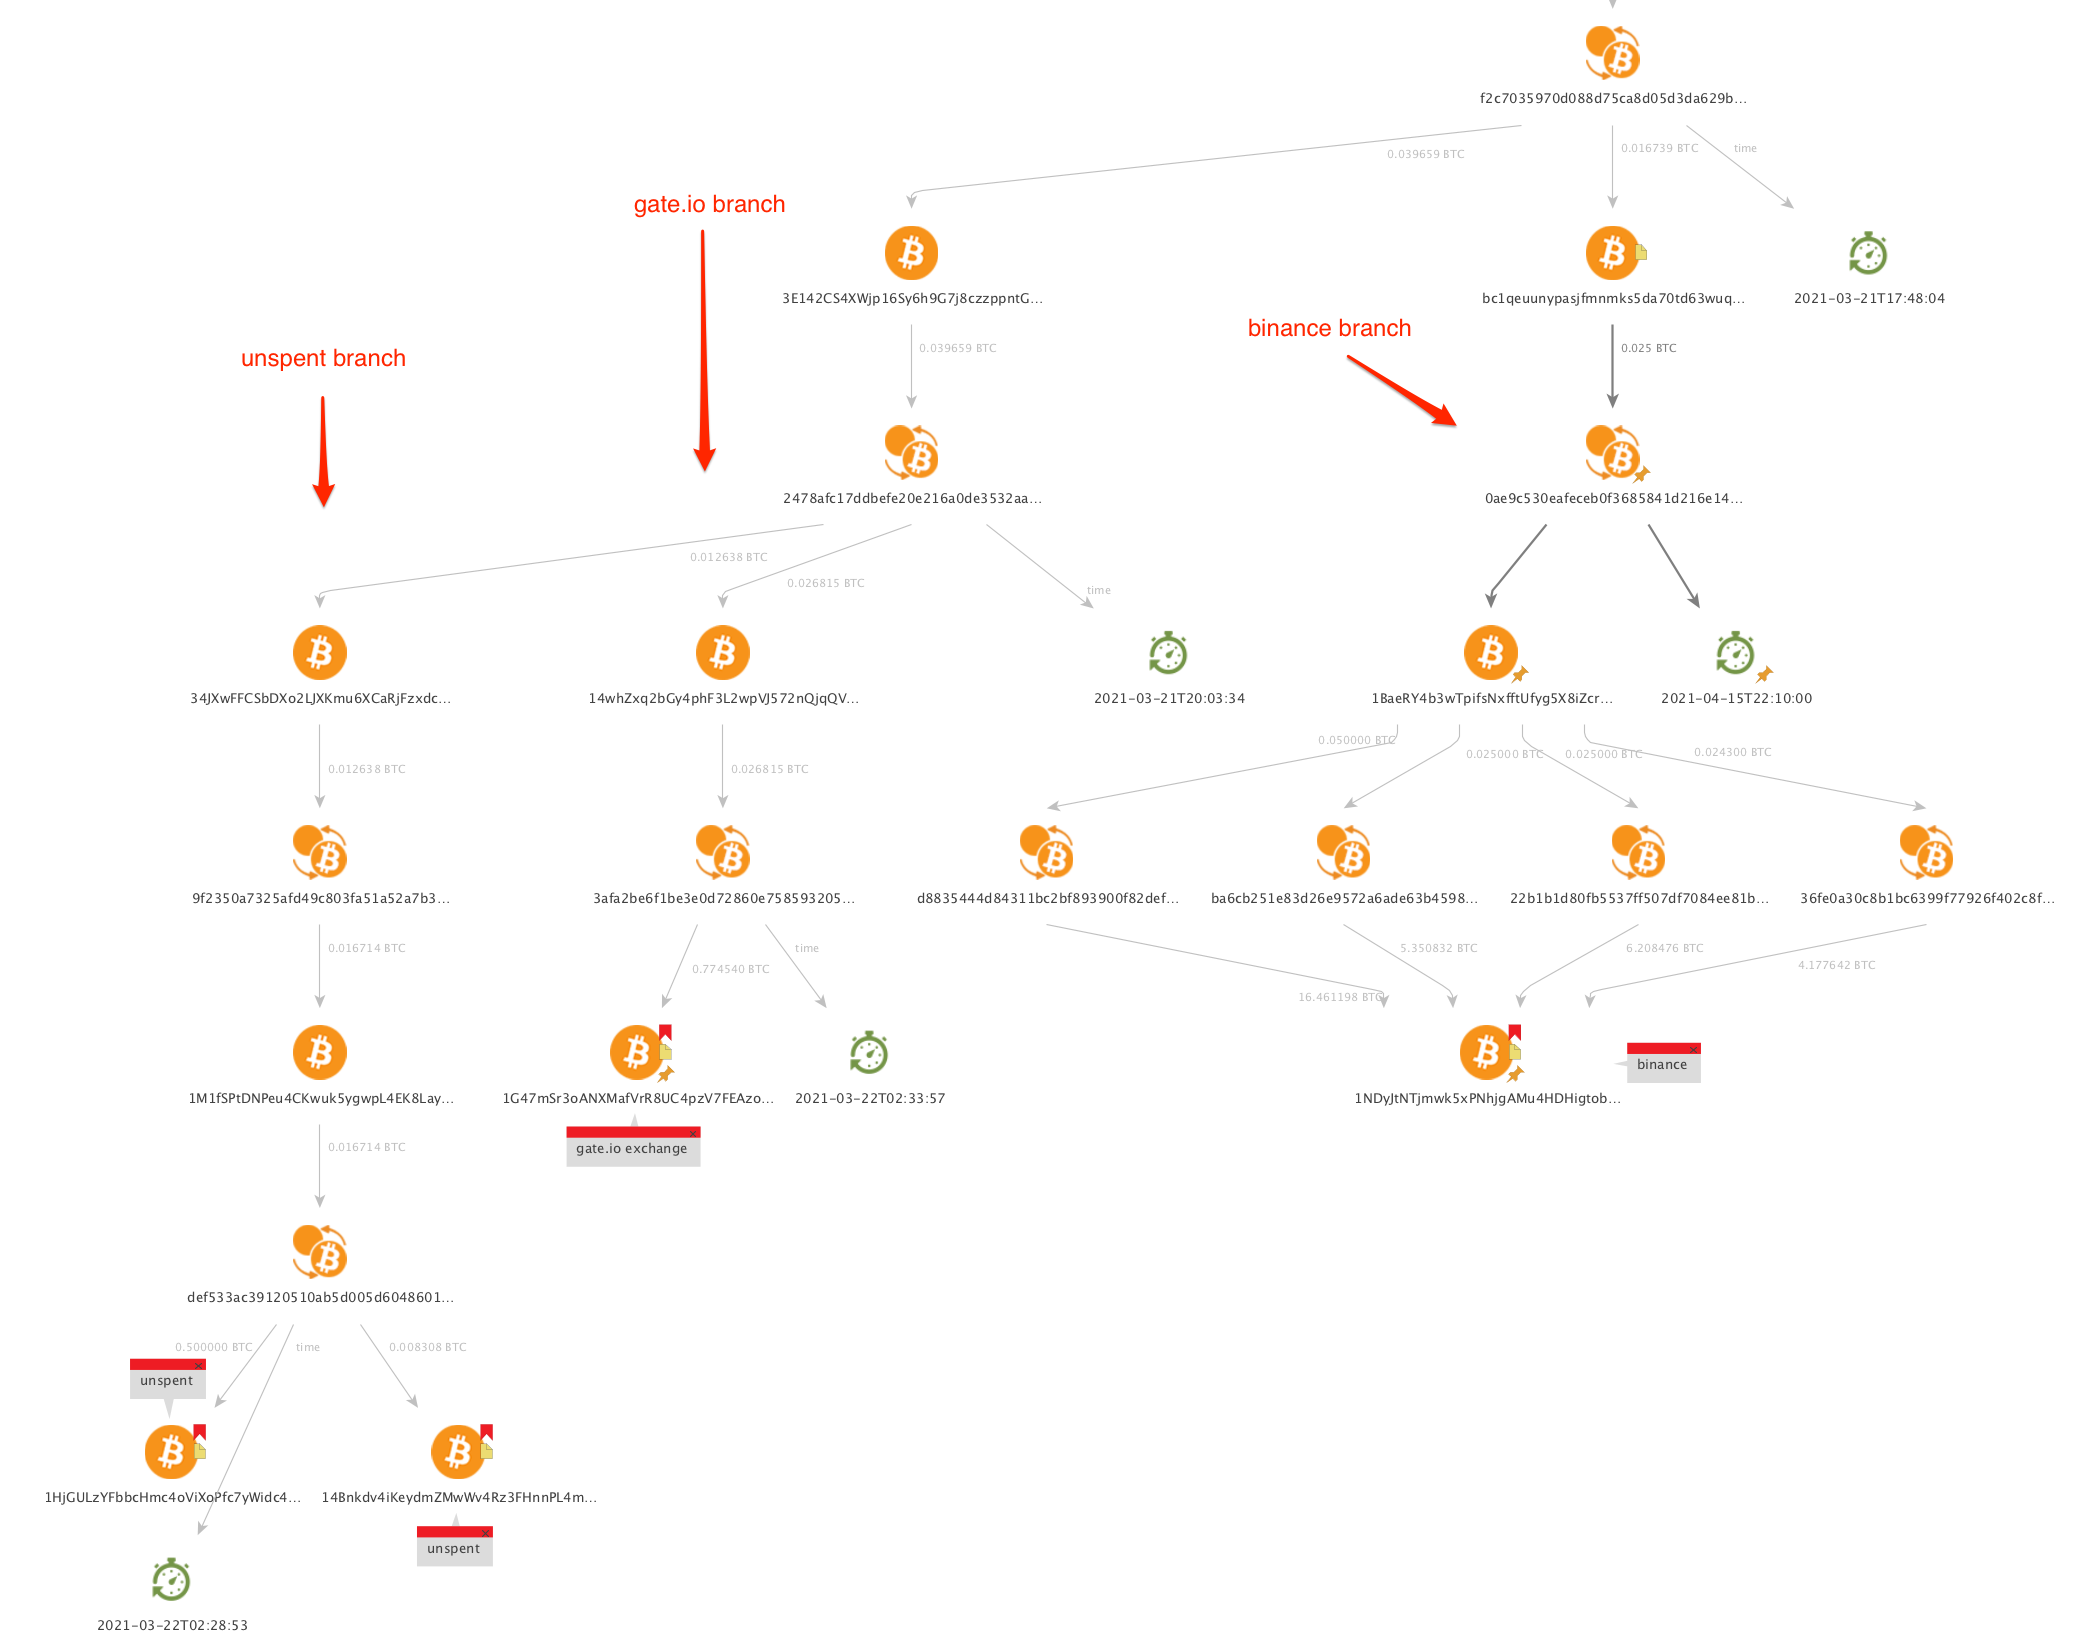
In the bottom part of the graph money flow continues as far as we are able to reach meaningful entites, in our case addresses belonging to certain exchanges, or the addresses with unspent transaction outputs, meaning that funds didn’t go any further from these addresses. So far, we already have three branches here, from left to right:
- Unspent branch, which ends up with two wallets from where funds were not moved further (at least at the moment of investigation).
- Gate.io branch, which leads us to gate.io exchange.
- Binance branch, which leads us to Binance exchange, and in this case funds are transferred in multiple transactions before they reach an exchange.
Most transaction entities on the graph also display corresponding timestamp (it is omitted from some transactions so not to clutter the graph), so we can make sure that flow of funds is organized in a logical way and underlying transactions happened actually after those on the upper levels.
What might we have missed here? As mentioned before, standard Maltego transformations do not provide any means for bitcoin addresses attribution and clustering (though this kind of data can be available when using commercially available Maltego transforms from CipherTrace). This said, we still have to match some blockchain entities manually using available open data sources. In our case is was not a problem to manually recognize Binance and Gate.io related addresses but this is not always the case.
Some addresses we are coming across in the process of visualizing might be of a particular interest because of certain indirect signs, for example unusually high number of transactions, or a high total throughput of bitcoins. Here’s one example of such address with over 60,000 transactions and total throughput over 8,000 BTC:

This data was fetched from blockchain by Maltego, but we don’t know how to attribute this address which, however, doesn’t look much like a regular private wallet. We can try to trace such addresses manually in Maltego by searching through input and output transactions but it won’t guarantee us neither fast nor confident result.
Given the ever-changing character of blockchain, even by using specific tools like GraphSense (or other commercial tools like Elliptic or ScoreChain) we as well may not be able to easily attribute such an address, but we at least could much faster determine its nearest neighbors and find which clusters or entities are sending to or receiving funds from this address.
So, in our case we use GraphSense to speed up the investigation and addresses attribution, and also to create more detailed money flow graph.
GraphSense graph
The logic in building GraphSense visualizations is somehow similar to Maltego: we start from a single entity (a wallet address) and then can trace its connections in both directions.
Entities on the graph are represented as clusters. Each cluster basically is a group containing one or more bitcoin addresses which are logically connected based on their similarity: activity, relation to the same entity like a crypto exchange or other different properties. Most simple case is a cluster of one address, when we don’t know anything about its relations with any other address. On the contrary, there are clusters belonging to very big entities like exchanges, which might contain thousands or even millions of addresses.
GraphSense is able to automatically add neighbours to the graph and connect them, and you can also choose to display either total number of transactions between addresses and clusters, or their monetary value, in our case it is shown in USD. Another great thing is that GraphSense can automatically determine and label clusters or addresses belonging to known entities like exchanges (shown colored on the graph below).
Our scam case at some point has ended up looking like this (which might still be not a final version):

Second from the left we have ther starting wallet we obtained from the scam website, which was manually marked as such on the graph. It has input transaction from a single address and two output transactions to different addresses.
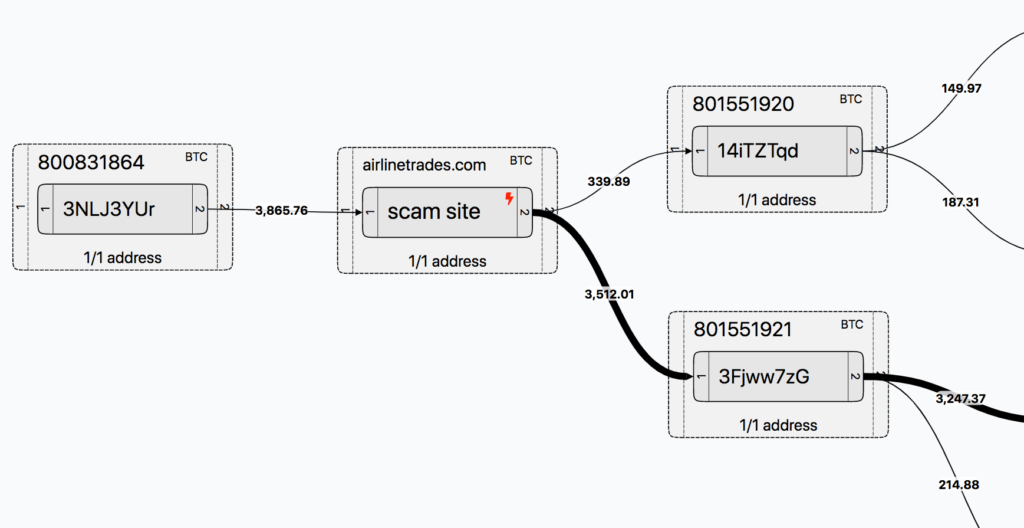
Depending on our needs, we are able to trace inputs and outputs either from single addresses or a whole cluster, so we have numbers of transactions displayed to the right and left of both a single address and a cluster.
Moving from left to right, we are following the money flow and are able to uncover different entities through which cryptocurrency is moving. Then we add a few more clusters on the graph so we don’t leave ‘hanging’ clusters without outputs in the middle and rearrange it so that output entities (exchanges) are cleary grouped on the right:

What we see here is actually a pretty simple case in which a sum deposited into scam wallet has been moved to certain exchanges and also left unspent in different proportions. It is simple in the sense that many intermediate addresses has only 1 input and 1 or 2 outputs, so the transferred amounts are undoubtedly related to scam wallet deposit at least for the following transactions:
- $149.97 –> Paxful.com
- $214.88 –> Coinbase
- $1449.97 –> Gate.io
In GraphSense interface we can also interactively check each transaction date by clicking on it (which unfortunately cannot be shown on the graph connectors). We already had Gate.io branch present on Maltego graph and the corresponding transactions dates are matching on both graphs.
However, Binance branch is a bit different, as it contains pretty big cluster 694932766 in between with too many inputs and outputs, and also other wallets which have multiple inputs as well, so obviously funds are mixed here with others. Thus we cannot definitely say whether part of the deposit to the scam wallet has actually reached Binance.
We also have some unspent outputs on the graph and they correspond to addresses with multiple inputs, which means funds related to our particulat scam wallet are mixed with others. For example address 1HjGULzYFbbcHmc4oViXoPfc7yWidc4j1B has 24 inputs and final balance of 0.5 BTC. Thus we may be sure that some part of the scam wallet deposit is actually included in that 0.5 BTC balance. However, this doesn’t make any sense from law enforcement point, because unless this balance is withdrawn, nothing can be done about it except just monitoring this address.
Looking separately at Binance branch, we can also trace back and add couple of clusters or addresses as an example (marked in red), and it is obvious that, though these entities are part of the money flow, they are definitely not part of the particular scam scheme, as the input funds are originated from somewhere else:

Which data is included in investigation diagrams
It is obvious that number of entities and interconnections in blockchain is really huge, and money flow diagram, once started from a single wallet / transaction, can be incrementally built almost to infinity. Blockchain transactions can have multiple inputs and outputs, sometimes up to a few hundreds. It doesn’t make sense to include all irrelevant addresses just because they belong to a certain transaction, as they don’t add any valuable info. However, we try to strictly limit the size of such diagrams so that they reflect only relevant information regarding a certain case.
In many cases we limit visualized transaction by a reasonable timeframe (usually 1 to 3 weeks period), in order to reflect the most recent and / or most relevant transactions. This is especially true for Maltego CE graphs because its non-commercial version is limited to only 12 output results from each transform.
Same logic applies to transaction amounts. Usually small amounts are excluded from the graph, when they are insignificant and don’t add value to existing findings (for example, change transactions).
What next?
So far we’ve looked at two powerful investigation tools, Maltego CE and GraphSense, which allow us to build money flow graphs and track funds involved in scam activity. Though these tools are different, they complement each other pretty well to help build a comprehensive picture of a scam scheme and follow the money.
In further articles on the topic we will take a detailed look on some scam cases and explore money flow graphs. We will also talk to actual scammers to find out how and why they are engaged in crypto scam business. Stay tuned.

Got feedback or want to share your experience with crypto scammers? Leave comment below, send email to blog@whatthefraud.wtf or use the contact form.